First, the picture
Two lines tell the whole story. Japan's working-age population — everyone aged 15 to 64 — topped out around 87.2 million in 1995 and has since drifted down to about 73.7 million. That's 13.5 million workers gone, more people than all of Tokyo. Now lay the tax burden on top of it. The number to watch is the National Burden Ratio: taxes plus social-security contributions, measured as a share of the country's income. Back in 1995 it was about 35.9%. Today it's roughly 45% — up more than nine points. One line falls, the other climbs, and they almost look like reflections of each other.
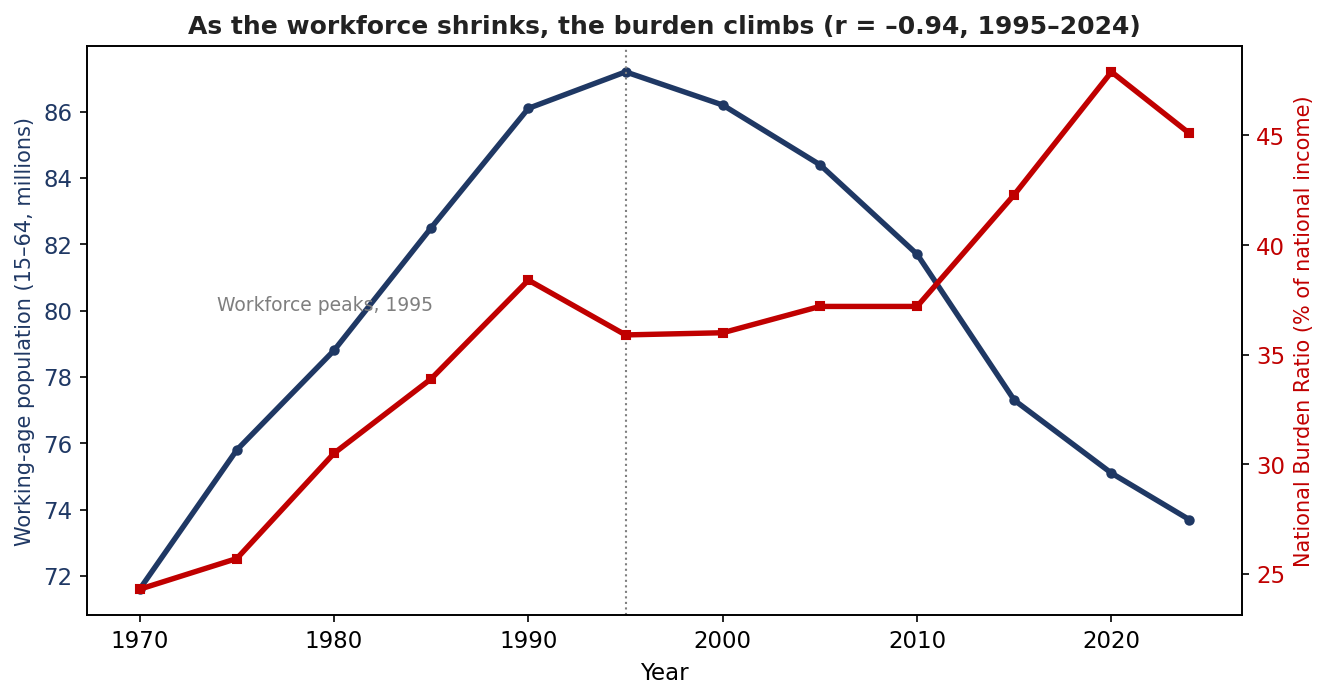
How close are those two lines, really? Close enough that I ran the numbers, and they came back almost eerie: a correlation of –0.94, with an R² of 0.88. If those look like jargon, stick with me — they're simpler than they sound.
A correlation is just one number, always between –1 and +1, that says how tightly two things move together. +1 means they rise in perfect lockstep. 0 means no relationship. And –1 means they're perfect opposites — one goes up exactly as the other comes down, like two ends of a see-saw. To get it, I took one data point per year from 1995 to 2024: how many workers there were, and how high the burden was. When the workforce is below average in the same years the burden is above average, you get a negative number. Ours came out to –0.94: almost a perfect see-saw.
The R² is even easier — it's that correlation multiplied by itself: (–0.94) × (–0.94) ≈ 0.88. So you read 0.88 as: about 88% of the ups and downs in the tax burden line up with the shrinking workforce. The missing 12% is everything else — recessions, one-off tax tweaks, the 2020 pandemic spike. One honest caveat: a tight correlation isn't proof that one thing causes the other. Here they're genuinely linked — an aging country both loses workers and runs up a bigger pension-and-health bill — but the decimal points aren't destiny.
There's also a fair-play footnote. Run the correlation across the whole stretch back to 1970 and it nearly disappears, because for the first couple of decades the workforce and the burden went up together — a growing country building out a welfare state at the same time. The demographic squeeze only takes over after 1995. So the claim is narrow but strong: since Japan started running out of workers, the load on the ones left behind has risen right alongside.
Four levies, two doors
Ask a Japanese office worker what his income tax rate is, and he'll tell you about the national tax — the progressive one, 5% up to 45%. That's the tax everyone fights about. And here's the twist: it's the one that barely moved. The top rate actually got cut over these years — from around 75% in the 1970s down to 50%, then 37%, before creeping back to 45% in 2015. If income tax were the whole story, this newsletter wouldn't exist.
It's not the whole story, because three other levies do the heavy lifting. Two of them grab your money on the way in. One waits for you on the way out.
Residential tax (住民税) is a local tax of about 10% on your income — split between your prefecture and your city — plus a small flat charge. Nobody counts it when they talk about "income tax," because it's local and sits in a different column of the national accounts. But make no mistake: it's a tax on the same yen you already earned.
Social insurance premiums — pension, health, long-term care, employment — are the big one, and the sneaky one. They're charged as a percentage of your salary, which makes them an income tax wearing a different hat. The pension premium alone was nudged up every single year from 2004 to 2017, from 13.58% to 18.3% of pay. Throw in health and the rest, and your own share of social insurance eats about 15% of your paycheck before income tax even shows up.
Consumption tax is the fourth, and it's waiting at the other door. It started at 3% in 1989, went to 5%, then 8%, and hit 10% in 2019. It taxes your income a second time — when you spend whatever made it past the first three. And it now brings in more money than the income tax does.
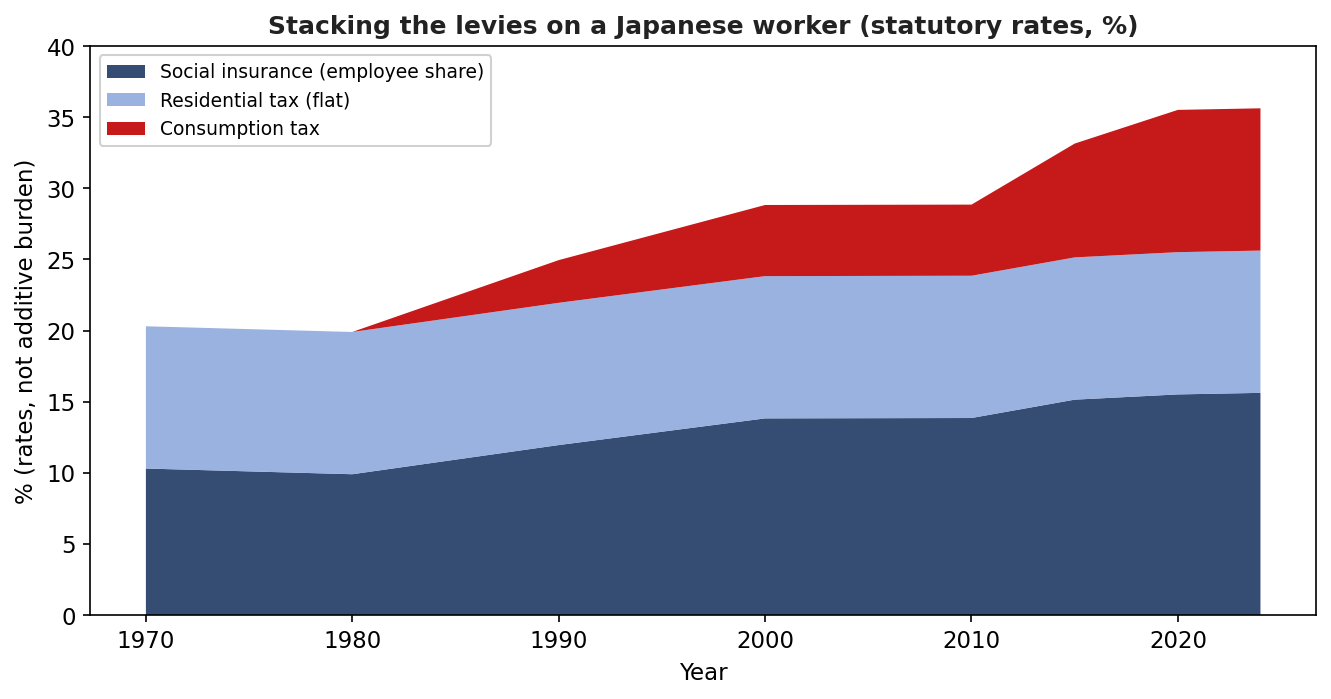
Add up just the two that hit your paycheck — your social-insurance share plus flat residential tax — and the bite on your wages has grown from about 20% in 1970 to roughly 25.6% today. And that's before the progressive income tax, and before the 10% skimmed at the register. The tax everyone argues about is the smallest piece of the trap.
The clever part
This is where it stops being a story about high taxes and becomes a story about design. Every choice points the same direction: collect the most, provoke the least.
Make the big levies flat. Income tax is progressive, so the wealthy feel it. Social insurance and residential tax are basically flat. Lean on the flat ones and you quietly move the weight off the rich and onto the middle — the nurses, the engineers, the shopkeepers. It's a redistribution that never had to call itself one.
Cap it at the top. Pension premiums stop rising once your pay clears a ceiling. Above that line, the effective rate actually falls — so the system tilts in favor of high earners, the exact opposite of the income tax it's quietly replacing.
Split it with the boss. The pension rate is 18.3%, but you only see half of it — 9.15% — on your payslip. Your employer "pays" the other half. Economists will tell you that half comes out of your wages eventually anyway, but you never see it. Half the tax is simply invisible.
Give it a good name. Premiums are tied by law to your pension and your healthcare. Every consumption-tax hike was sold as money for the elderly. "For your pension" goes down a lot easier than "for the treasury" — which is exactly why they always used the first line.
And bill it a year late. Residential tax is calculated on last year's income and collected this year. If you're on the way up, no big deal. But if you just retired, lost your job, or took a pay cut, the bill from your good year lands right when the money to pay it is gone. In a country full of people retiring, that timing catches someone new every day.
Meanwhile, the paycheck went nowhere
A rising burden you can live with — if your pay is rising too. Japan's wasn't. The average private-sector salary peaked around ¥4.67 million in 1997 (the same year the workforce started shrinking — no coincidence), sank to about ¥4.06 million by 2009, and has only lately crawled back toward the old high in plain numbers. Adjust for all those consumption-tax hikes and price rises, and the worker of 2024 isn't really any better off than the worker of 1997.
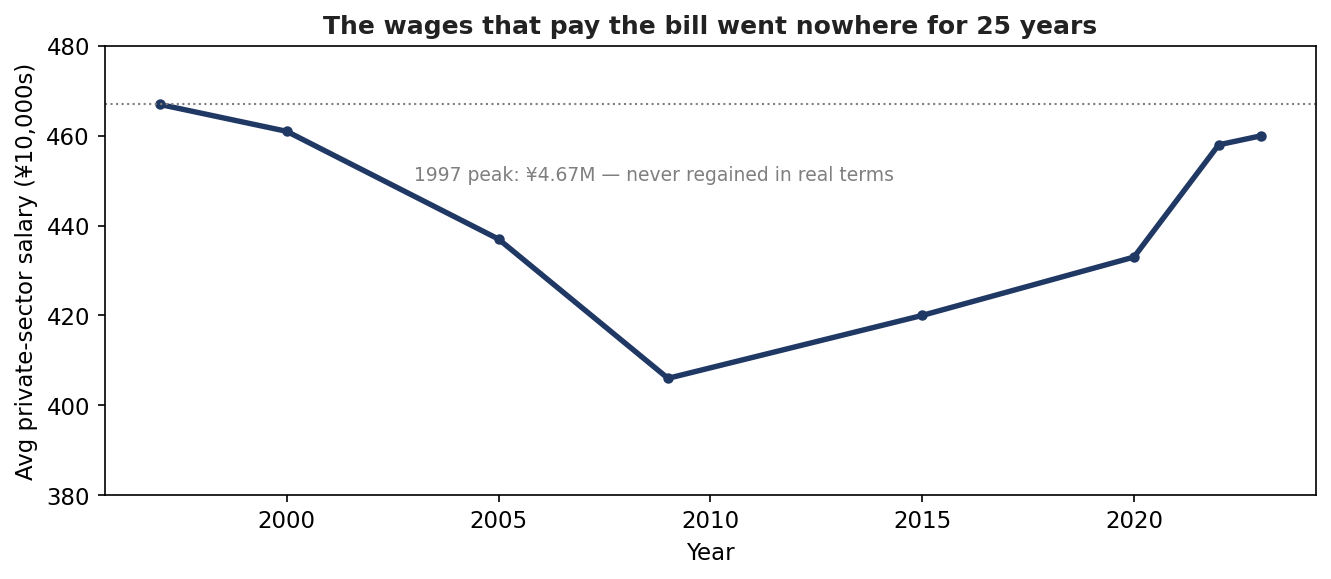
That's the vise: a bigger and bigger slice, carved off a paycheck that basically stopped growing for 25 years. And it's the reason Japan reached for flat premiums and consumption taxes in the first place. You can't wring more progressive income tax out of a shrinking pool of people whose wages aren't going up. So the government did the next best thing — it widened the net and flattened the rate, taxed spending as the income growth it would have preferred to tax never showed up.
Now the other jaw of the trap
Follow the biggest "for your pension" promise and you find the second half of the design — because the same workers being charged more are also lined up to receive less.
The fund itself looks fantastic, to be clear. Japan's Government Pension Investment Fund (GPIF) is the largest pension pool on the planet — ¥277 trillion, about $1.87 trillion, as of September 2025 — and it's returned north of 4% a year since 2001. But that's just the headline. Since 2020 half its money has been parked in foreign assets, so as the yen has collapsed, the yen value of those holdings balloons. Dazzling returns, part currency mirage.
And here's the thing most people miss: that giant fund is a cushion, not the system. Japan's pension is mostly pay-as-you-go — today's premiums pay today's retirees, and the ¥277 trillion only covers a few years of benefits. So the fund's investing skill is almost beside the point. What actually decides whether the system holds up is the arithmetic of workers versus retirees — and that arithmetic is getting worse every year.
So how does the government keep the promise affordable? It quietly shrinks it. In 2004 it slipped in something called the macroeconomic slide — an automatic rule that lets pension benefits grow slower than prices and wages, dragging the books back toward balance as the country ages. Same trick as before: no vote, no headline, just a formula trimming what retirees really get, year after year. The official yardstick — pension as a share of a working-age income — was 61.7% in the 2019 review and is projected to slide toward the 50% floor the government has pledged to hold (and below it if the economy disappoints). At the same time, the effective retirement age keeps creeping up, with people nudged to hold out until 70 or 75 for a bigger check.
The trap, in one breath
Put both jaws together and the shape jumps out. A shrinking workforce pays more in — through flat, employer-split, nicely-named premiums, a local tax billed a year late, and a consumption tax on whatever's left — and is set to get less back out, through an automatic benefit haircut and a later retirement. And almost none of it runs through a line item anyone would think to vote against. The one tax people do argue about? They cut it.
Three things to take away from all this. One: Japan is the clearest proof that demographics, not political parties, ultimately set the tax burden — and every aging democracy is somewhere on this same road, just further back than Japan. Two: watch the channel, not the headline rate. The real action is in premiums and consumption taxes, the levies built to be noticed the least. Three: don't bet on a roaring consumer here. A middle class squeezed from both ends, on flat wages, with a slimmer pension ahead, isn't a spending boom waiting to happen.
There's a live twist, too. Consumption tax turned into a real fight in the last general election — the government floating a temporary suspension, the opposition wanting to scrap it altogether. The fact that we're even having that argument tells you the quiet part is getting loud. People have started counting the small cuts. Whether any government can actually unwind a machine this well-built — flat, earmarked, self-adjusting, in a country with fewer workers every year — is the real question. So far, the math has always won.
The fine print
Figures are compiled from the standard published series of Japan's Ministry of Finance (National Burden Ratio), Statistics Bureau (population), Ministry of Health, Labour and Welfare and Japan Pension Service (social insurance, replacement rate), and the National Tax Agency (salary survey; consumption and income tax); GPIF (fund assets). They are close approximations for illustration. This is analysis, not investment or tax advice.